Network I/O Monitoring Extension
Metrics Server provides CPU/memory usage, but not network I/O metrics. If you need per-container network usage, install the Network I/O Monitoring Extension.
- When you need to view per-container network traffic
- When you suspect a network bottleneck and want per-Pod traffic analysis
Monitoring Components
Metrics Server vs Monitoring Extension
Let's compare the role of each tool.
- Metrics Server: Provides CPU/memory resource metrics. Used by HPA and the
kubectl topcommand. All CPU/memory usage displayed in KIOPS is collected through Metrics Server. - cAdvisor: The lightweight option. Deployed as a DaemonSet on each node to collect container resource and network metrics. This is the recommended option.
- Prometheus Stack: The standard option. Installs the kube-prometheus-stack chart with Helm, enabling metric collection, querying, and long-term storage. For advanced users.
In the KIOPS Network I/O Monitoring Extension modal, you can install only one of cAdvisor or Prometheus Stack via a radio button. There is no flow to install both together.
Prerequisites
- A Kubernetes cluster must be registered in KIOPS.
- Helm must be installed on the cluster master node.
- Sufficient cluster resources (for Prometheus Stack).
Permission Notice: If you cannot access this feature, please request permission from your organization manager.
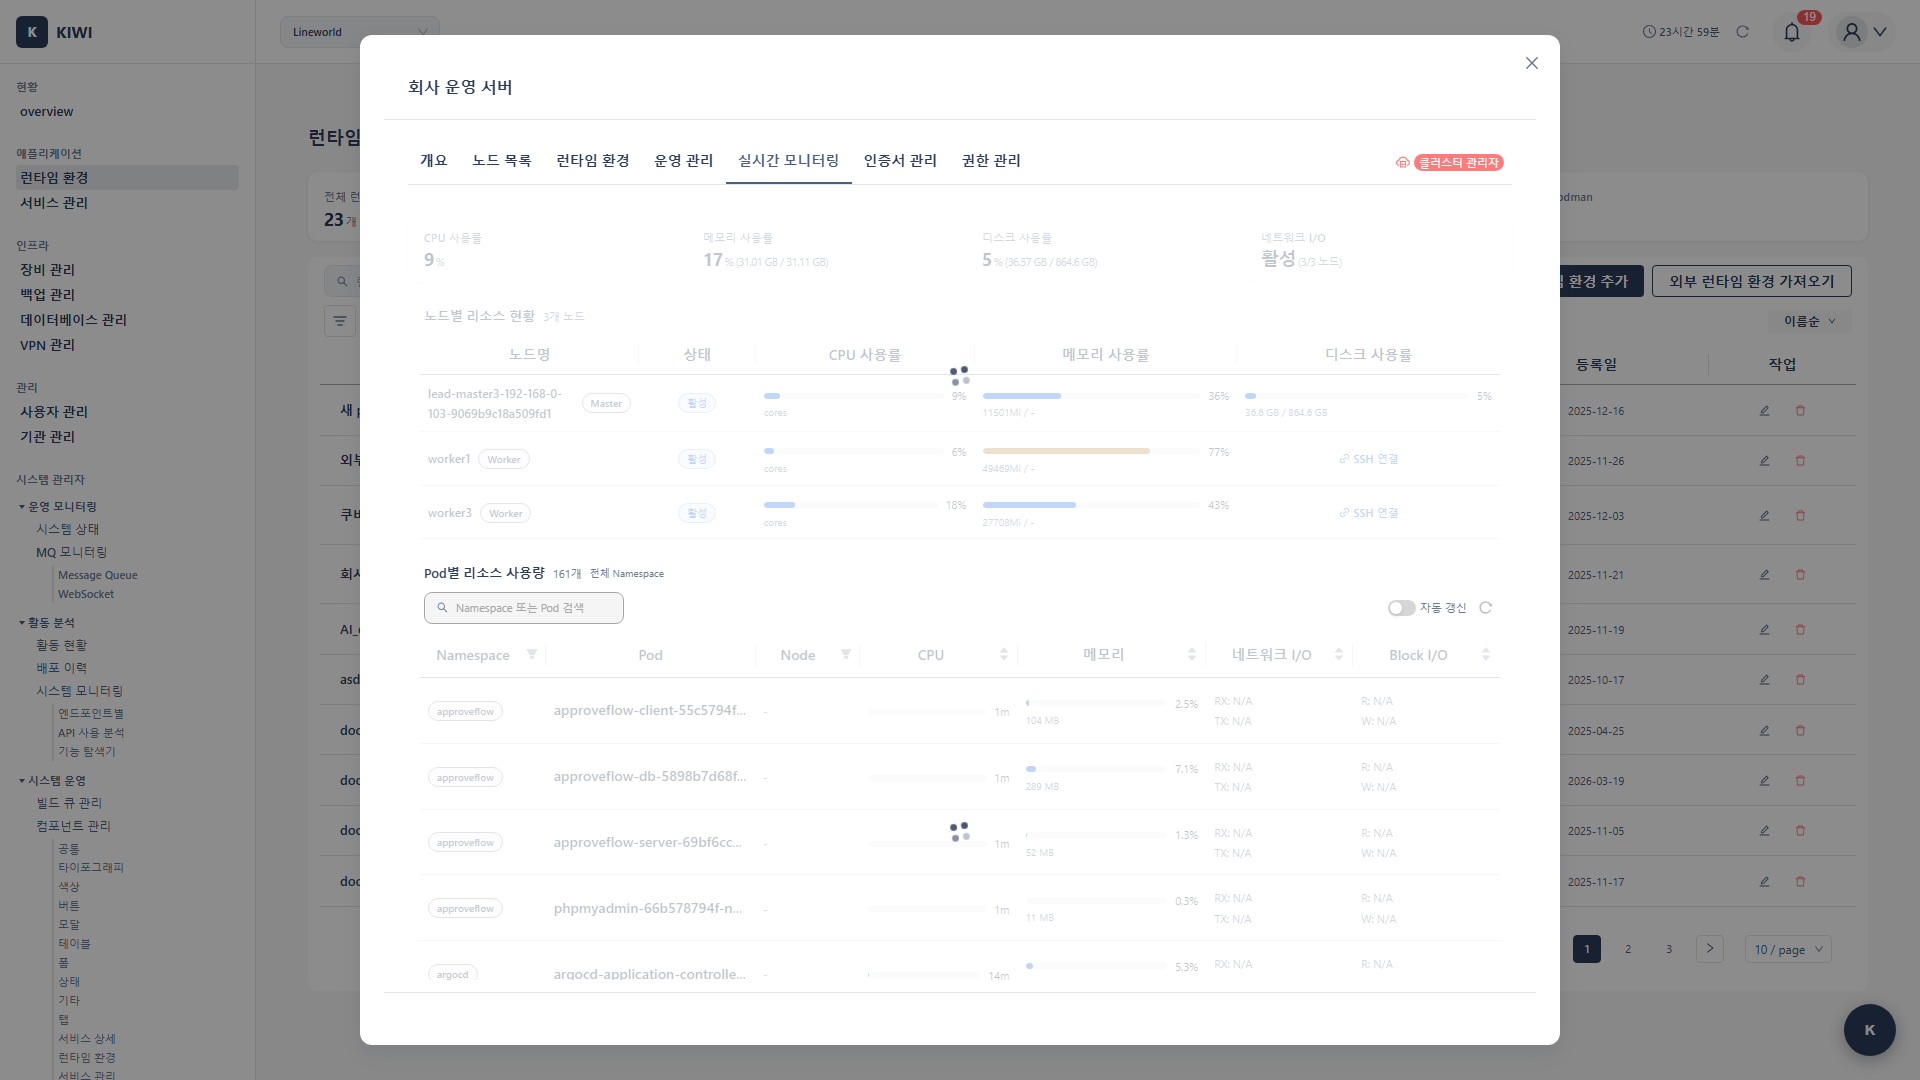
Step 1: Navigate to Real-time Monitoring Tab
- From the [Runtime Environments] page, select the target cluster.
- Click the Real-time Monitoring tab on the cluster detail page.
- Click the Network I/O Monitoring Extension button to open the modal.
Step 2: Preflight Check (12 items)
When the modal opens, the following 12 items are automatically checked.
- connection: Whether SSH to the master node is possible
- commands: Whether required commands (kubectl, helm, etc.) exist
- kubernetes_version: Whether the Kubernetes version is supported
- helm_installed: Whether Helm is installed (required for Prometheus Stack)
- available_memory: Whether available memory is sufficient
- available_disk: Whether available disk space is sufficient
- namespace_permission: Permission to create namespaces
- cluster_permission: Permission to create cluster resources
- network_access: Network access for pulling container images
- storage_class: Whether a usable StorageClass exists
- node_count: Node count
- existing_installation: Whether a previous installation exists
Based on the recommended_option returned by the preflight check, the radio button default is automatically set. In general, cAdvisor is recommended for resource-constrained or simpler environments, while Prometheus Stack is recommended when sufficient resources and Helm are in place.
Step 3: Choose Installation Option
After preflight check passes, choose one of the following radio options.
- Install cAdvisor (lightweight, recommended): The lightweight option. Deploys cAdvisor as a DaemonSet on each node to collect container metrics.
- Install Prometheus Stack (standard, advanced): The standard option. Uses Helm to install the kube-prometheus-stack chart, which includes Prometheus, Grafana, and Alertmanager.
Each option's required resources (recommended memory/disk, etc.) are shown only as requirements text. There is no UI to directly enter CPU/memory/storage values. There is also no UI for retention period or alert rules (Slack/Email/Webhook).
Step 4: Execute Install (5 phases)
When you click Start Install, the backend executes the following 5 phases.
- prepare: Preliminary preparation tasks
- namespace: Create the monitoring-dedicated namespace
- helm_repo: Add the Helm repository (for Prometheus Stack)
- install: Install components (cAdvisor DaemonSet or Helm chart)
- verify: Verify the installation
Depending on the option, some phases may be skipped or behave differently. For example, cAdvisor may not run the helm_repo phase, while Prometheus Stack runs all 5 phases.
Background Execution Supported
If you close the modal during installation, the backend job keeps running. When you return to the Monitoring tab later, you can see the progress and result.
Check Installation Status
Status Display
You can check the status of each component in the Monitoring tab:
- Not Installed: The monitoring component has not been installed yet.
- Installing: Installation is in progress. Typically takes 1-3 minutes.
- Running: The component is operating normally.
- Error: An error occurred. Try reinstalling if necessary.
Real-time Metric Verification
Metrics available in KIOPS after installation:
Node Level (Metrics Server + Extension):
- CPU usage (%) — provided by Metrics Server
- Memory usage (GB / %) — provided by Metrics Server
- Network I/O — provided by the monitoring extension
Pod Level:
- Per-container CPU/memory usage — provided by Metrics Server
- Per-container network traffic — provided by the monitoring extension
- Restart count
Regardless of whether the monitoring extension (cAdvisor / Prometheus Stack) is installed, CPU/memory usage is collected via Metrics Server. Installing Metrics Server first is therefore recommended.
Troubleshooting
Preflight Failures
- helm_installed fails (when Prometheus Stack is selected): Helm is not installed on the master node. Ask a cluster administrator to install Helm and try again. Alternatively, choose cAdvisor to install without Helm.
- available_memory / available_disk fails: Insufficient resources. Switch to the cAdvisor (lightweight) option or free up cluster resources.
- storage_class fails: No usable StorageClass. A StorageClass must be created on the cluster first.
cAdvisor Installation Failure
- When DaemonSet deployment fails: Insufficient resources on nodes to schedule cAdvisor Pods. Check node resource availability.
- When image pull fails: Check cluster node internet connectivity or private registry settings.
Prometheus Stack Installation Failure
- Helm chart install failure: On the master node, inspect with
helm repo listandhelm list -A. - When OOM (Out of Memory) occurs: Node memory is insufficient. Add a larger node or switch to the cAdvisor option.
Metrics Not Being Collected
- Cause 1: cAdvisor/Prometheus Pod is not in Running state.
- Cause 2: Blocked by a network policy.
Resolution:
- Check Pod status:
kubectl get pods -n monitoring - Check logs:
kubectl logs <pod-name> -n monitoring
Related Guides
- Metrics Server Installation - Basic metrics server installation.
- Runtime Environment Registration - Register K8s cluster.
- Log Monitoring - View container logs.