Quality Metrics
How often and how reliably are you deploying your services? The Quality Metrics tab brings DORA metrics and incident history together in one place so you can track deployment quality.
Quality metrics live in the [Quality] tab of the [Security Analysis] page. They previously appeared in the service detail (dashboard) and service management views, but were consolidated into the [Security Analysis] page on 2026-06-04.
How to Access
- Click the [Security Analysis] menu in the sidebar.
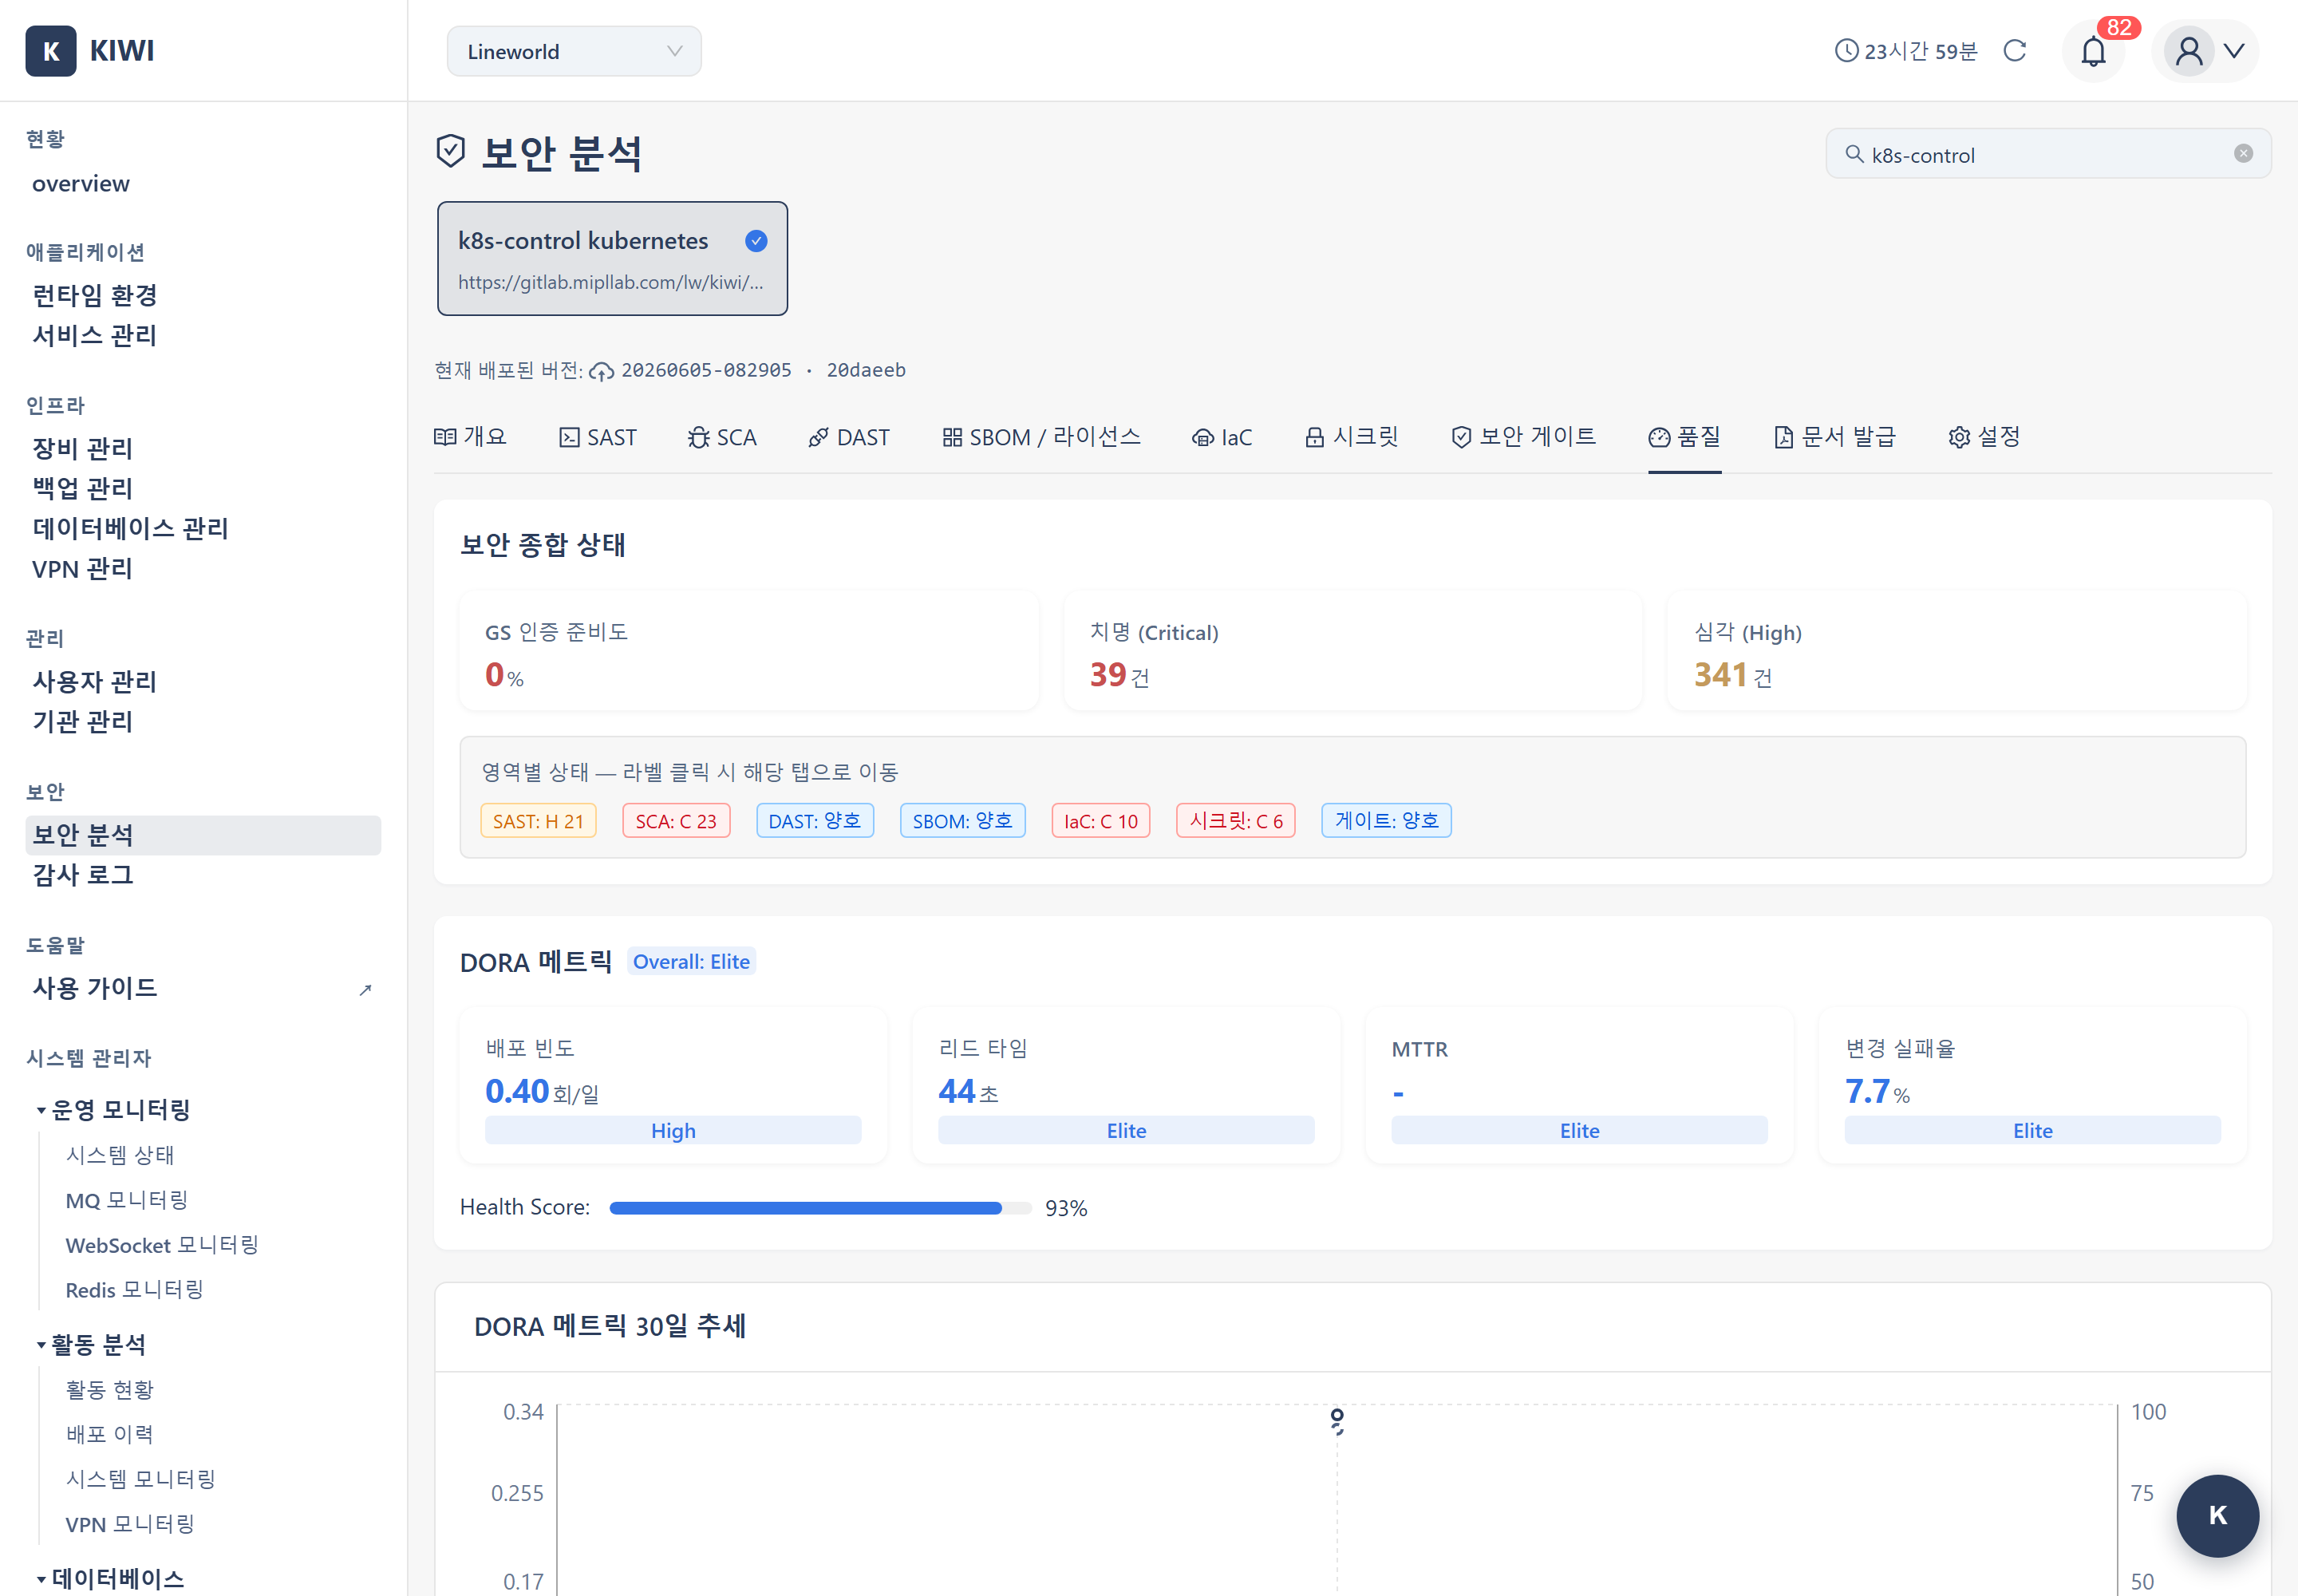
- Select the target service at the top of the page.
- Click the [Quality] tab.
The [Quality] tab shows only operational quality metrics such as deployment stability (DORA), pipeline metrics, and incident history. Check the overall security score (readiness) on the [Overview] tab of [Security Analysis]. To avoid duplication, the Quality tab does not repeat the security score.
From top to bottom, the [Quality] tab is organized as DORA Metrics → DORA 30-day trend → Pipeline Metrics (30 days) → Incident History.
DORA Metrics
DORA (DevOps Research and Assessment) metrics are four key indicators that measure deployment performance.
- Deployment Frequency: How often you deploy. Low frequencies are shown per week or per month.
- Lead Time for Changes: Time from when a change starts to when it is deployed. Shown in seconds, minutes, or hours.
- Change Failure Rate: Percentage of deployments that fail (%).
- Time to Restore (MTTR): Average time to recover after an incident occurs.
Each metric is graded as Elite / High / Medium / Low based on its measured value.
| Grade | Deployment Frequency | Lead Time | Change Failure Rate | Time to Restore (MTTR) |
|---|---|---|---|---|
| Elite | 1+ per day | ≤ 1 hour | < 15% | ≤ 1 hour |
| High | 1+ per week | ≤ 1 day | < 30% | ≤ 1 day |
| Medium | 1+ per month | ≤ 1 week | < 45% | ≤ 1 day |
| Low | Less than above | More than above | ≥ 45% | More than above |
Elite and High are shown in blue, Medium in orange, and Low in red, so you can grasp the status at a glance.
When no incidents are registered, Time to Restore is shown as - and "No incidents" instead of a grade (Elite). This means MTTR cannot be calculated because there is no incident data, not that performance is top-tier.
DORA 30-Day Trend
Below the DORA metrics, a trend chart for the last 30 days is shown. It visualizes daily snapshots (dora_metrics_snapshots) accumulated over time, with points building up from when snapshot collection began. If there is no data yet, a "shown after snapshots accumulate" message appears — this is a data-accumulation wait state, not a defect.
Pipeline Metrics (30 days)
This shows day-to-day build/deploy operational metrics that the four DORA indicators do not cover. For the last 30 days, you can review the pipeline success rate and the average, maximum, and minimum durations. If no pipelines ran in the last 30 days, an empty state is shown.
Incident History
Incident history records and tracks incidents that occurred in a service. It is the basis for calculating the change failure rate and time to restore (MTTR).
Registering an Incident
- Click the Register Incident button in the [Quality] tab.
- Enter the incident details:
- Title: A title that identifies the incident
- Severity: Choose from Critical / High / Medium / Low
- Occurred / Resolved time: When the incident started and was resolved
- Once saved, it is added to the incident history list and reflected in the DORA metrics (change failure rate and time to restore).
DORA metrics are calculated from deployment pipeline run records and incident history. Register every incident as it happens so the change failure rate and time to restore reflect your actual operational quality.
Related Guides
- Security Gate — Combined deployment verdict across security areas
- Dashboard Usage — See all services at a glance