DAST Scan
Some vulnerabilities cannot be found just by looking at code. DAST (Dynamic Application Security Testing) detects vulnerabilities by sending HTTP requests to an actually running application. It tests the application as if a hacker were attacking it from the outside.
SAST analyzes code, but it cannot find server misconfigurations or deployment environment issues. For example, missing security headers, cookie configuration errors, and CORS misconfigurations can only be confirmed when the application is actually running. DAST finds these runtime vulnerabilities.
Overview
- Analysis target: A deployed, running web application
- Analysis engines: OWASP ZAP + Nuclei (run simultaneously)
- Analysis method: Sends real HTTP requests and analyzes the responses
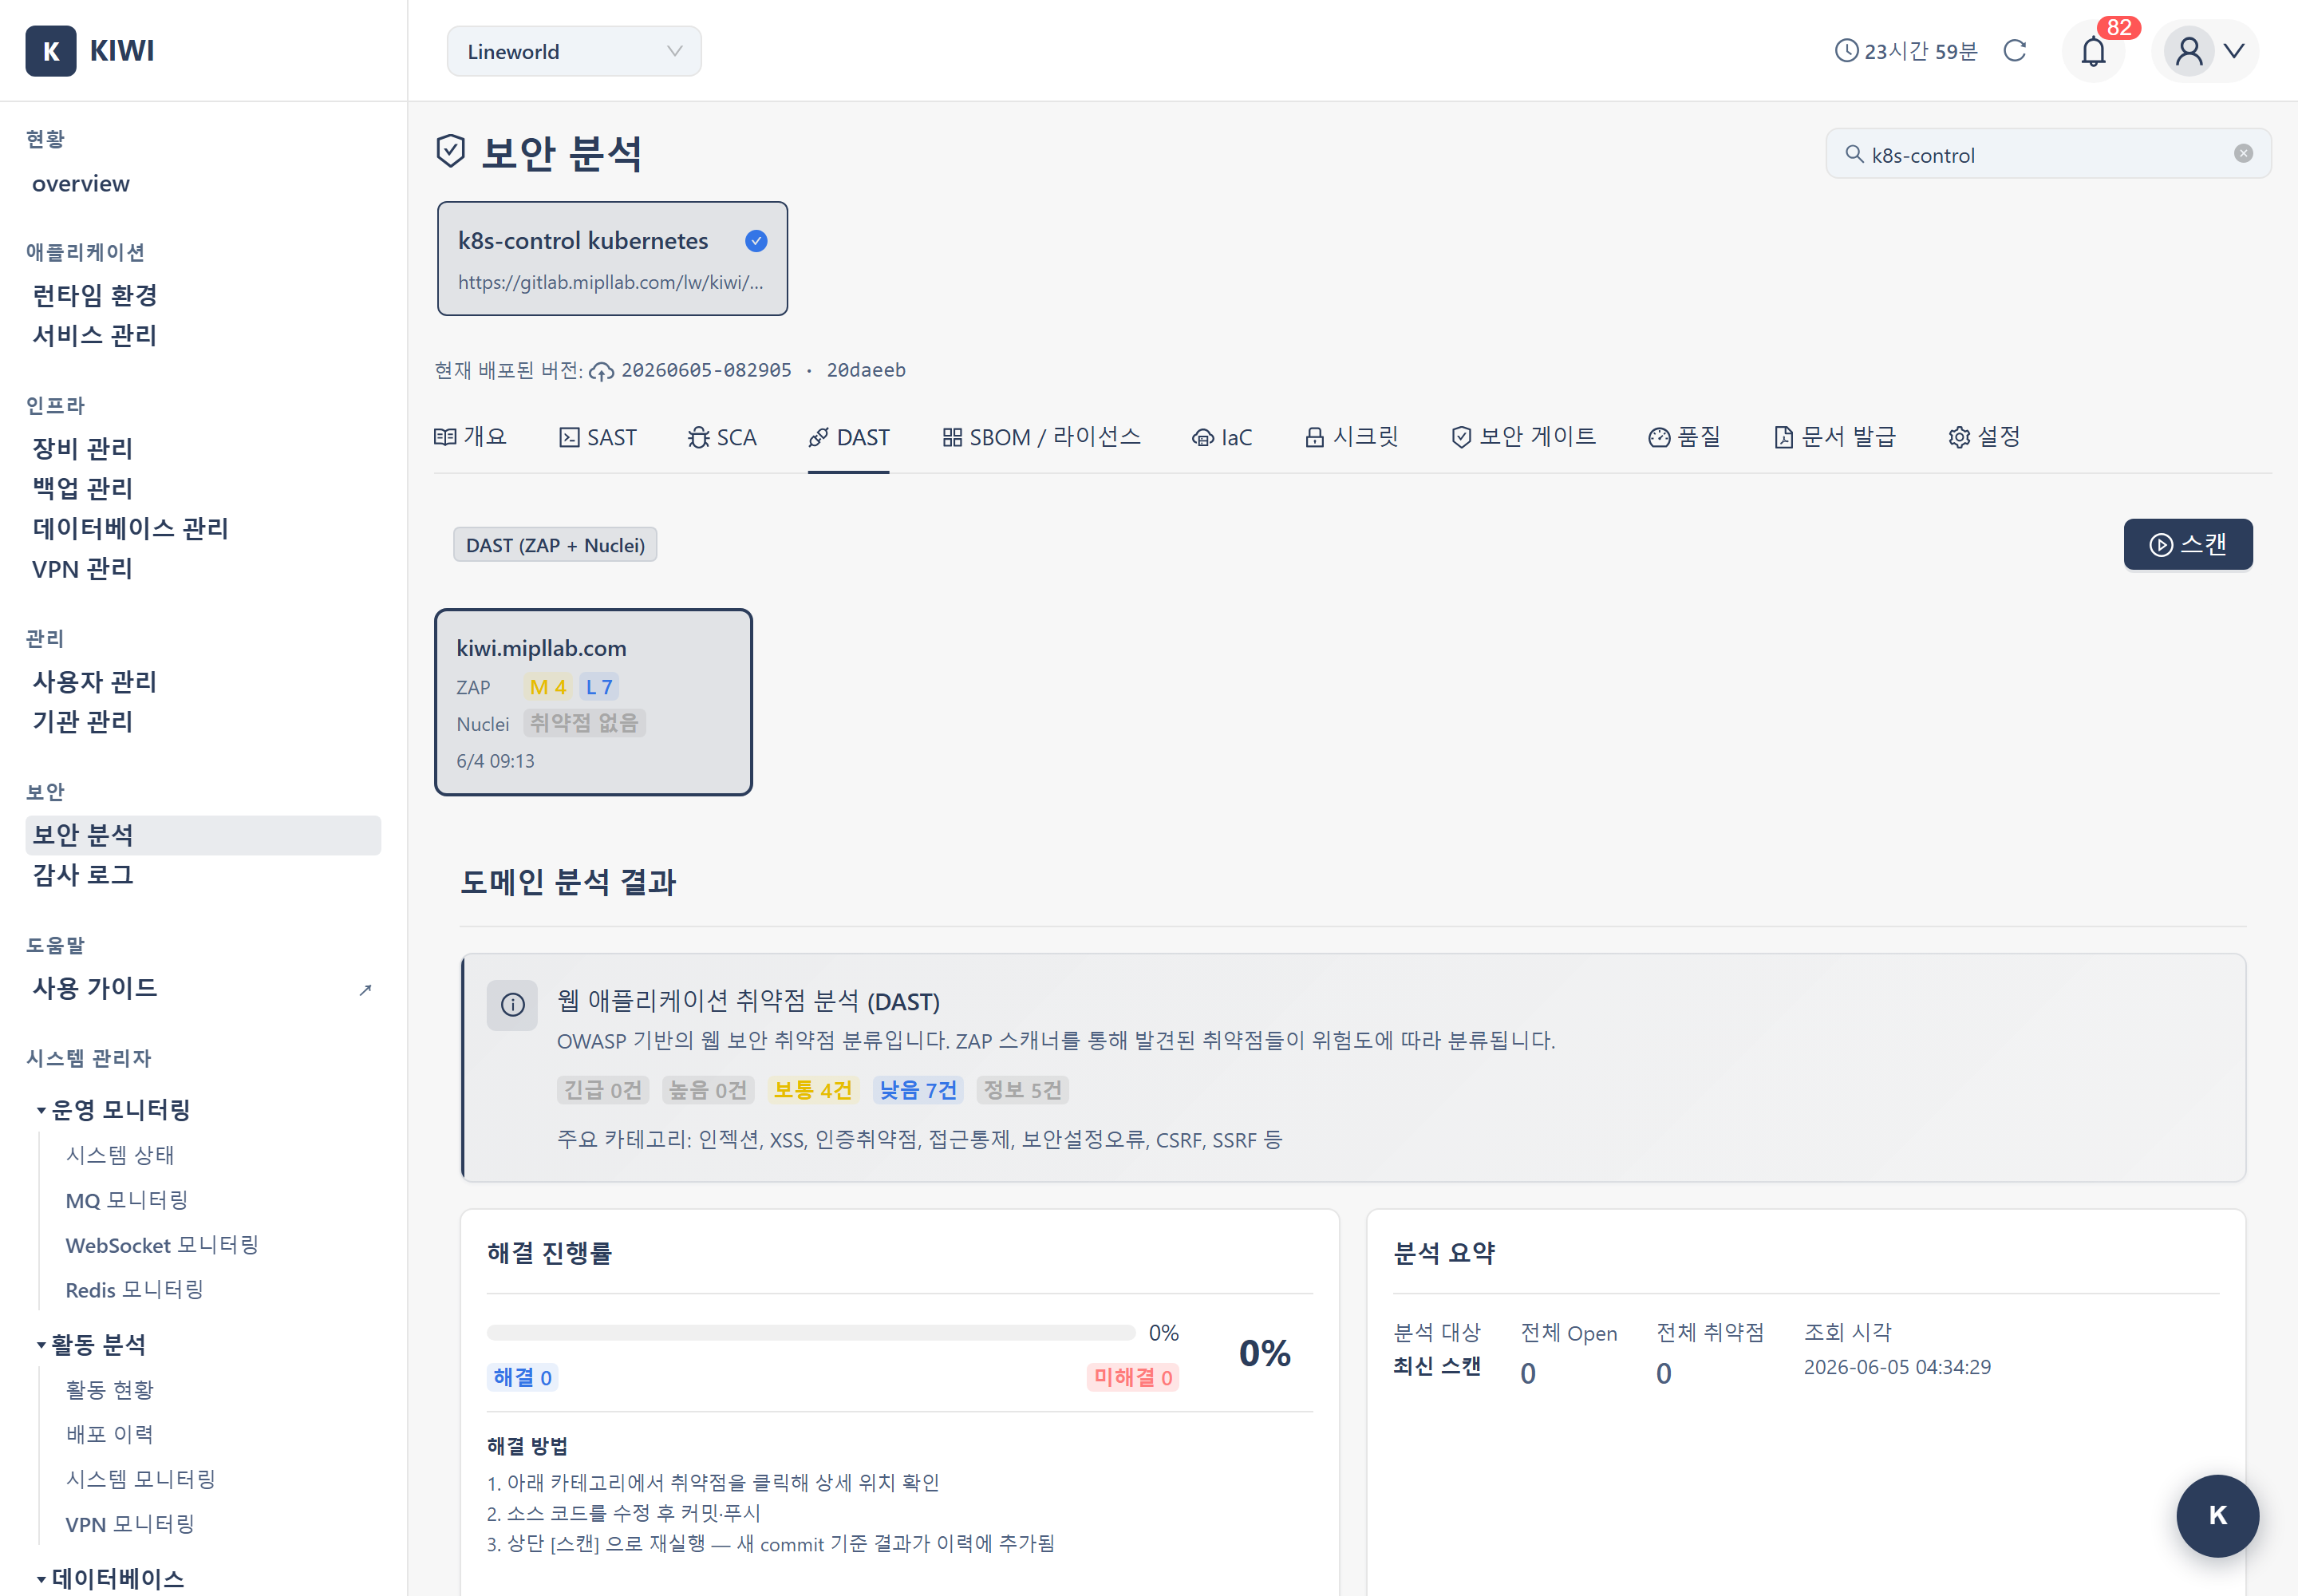
OWASP ZAP and Nuclei run at the same time against the target domain, with results displayed in a unified view. The two tools provide different analytical perspectives, so viewing them together enables a more comprehensive risk assessment. If one tool fails, the other continues (Promise.allSettled pattern, SecurityScanTriggerBar.tsx line 367).
Characteristics of DAST
Advantages
- Real environment testing: Tests in an environment identical to production to identify real risks
- Misconfiguration detection: Finds security issues in web server, framework, and cloud configurations
- Authentication testing: Verifies authentication issues such as login bypass and session management vulnerabilities
- Runtime vulnerabilities: Detects issues that appear only at runtime and cannot be seen from code alone
SAST vs DAST
- SAST: Analyzes source code during development. Covers the entire codebase and finds problems early.
- DAST: Analyzes a running app after deployment. Covers only accessible endpoints and finds misconfigurations and runtime vulnerabilities.
SAST and DAST are complementary. Run SAST during development and DAST after deployment to cover different types of vulnerabilities.
Step 1: Entering the DAST Scan
- Click the [Security Analysis] menu under the "Security" group in the sidebar.
- Select a service to analyze from the card carousel at the top of the page.
- Select the DAST tab.
Entering /security?id={serviceId}&area=dast opens the DAST tab for that service directly.
Step 2: Preparing the Scan
When the DAST modal ([Domain Analysis (DAST) · OWASP ZAP + Nuclei]) opens, configure:
- Target URL: Select a domain from the service's registered domains, or enter a URL manually
- ZAP Scan Type: Choose baseline (default, 450s) / full (900s) / api (450s). Nuclei always runs with the default profile.
The DAST modal can toggle between two domain selection modes (select / manual).
- select: Choose from the list of auto-detected domains. External Nginx domains mapped to the service are shown as a card strip, with each card providing the domain name, last scan status and time, and a rescan button. When there are multiple domains, click a card to switch the target domain.
- manual: Enter the URL manually in the
target_urlfield
Select the ZAP scan type that suits your purpose.
- Baseline (short active scan): Overall 450s timeout. A short, limited active scan that detects missing security headers, cookie configuration issues, basic injection/XSS patterns, etc. Recommended for development environments and CI pipelines.
- Full (active scan): Overall 900s timeout. Sends malicious payloads to test for SQL Injection, XSS, etc. Recommended for staging environments.
- API (API-specific scan): Overall 450s timeout. A scan optimized for REST API endpoints.
Full scans send real attack payloads, which in production environments can cause increased server load, data changes, and temporary errors. In production, run only Baseline scans, or run Full scans in a staging environment.
If no domain is registered, use the "Register domain here" button within the Security Analysis page to add one inline. It is registered without leaving the page (DomainAddModal integration) and supports various infrastructure types including external Nginx and Kubernetes Ingress.
DAST scans do not produce SBOM or license information. SBOM/License is an independent scan, unrelated to SAST, SCA, or DAST, run directly from the SBOM / License tab (both source SBOM and image SBOM).
Step 3: Running the Scan and Real-Time Progress
When you click the Start Scan button, progress is shown in real time via WebSocket. While a scan is in progress, the button label changes and the current stage label is exposed dynamically alongside a progress percentage (0-100%).
WebSocket Progress Stages
ZAP runs spider (crawling) and active_scan sequentially, and the following stage labels are shown in order while the scan runs.
- ZAP environment setup
- Configuring scan options
- ZAP daemon starting
- Site crawling
- Active security scan
- Report generation
- Result parsing
Because ZAP and Nuclei run simultaneously, Nuclei stage labels (e.g., Nuclei template checks) may also progress alongside.
Results (Completion/Failure)
Real-time progress messages are displayed via WebSocket, and when the scan ends it transitions to a final completed or failed state. On completion the results become available; on failure an error message is shown.
Step 4: Reviewing Results
4.1 Result Summary
When the scan completes, metrics such as the number of alerts by risk level and the scan duration are exposed.
4.2 Categorized View
Each alert can be classified and handled with the following statuses.
- open: Newly detected, unhandled alert
- resolved: Fix completed
- false_positive: Confirmed false positive
- accepted_risk: Risk accepted (acknowledged but will not be fixed)
4.3 Alert Details
Clicking each alert shows the vulnerability type, risk level, URL, parameter, evidence (request/response), recommended solution, and reference links.
Evidence includes the actual request and response. This lets you reproduce the vulnerability and verify it after fixing. Sharing the evidence when handing off a vulnerability to developers speeds up understanding.
4.4 Viewing Scan History
View past scan records in the "Scan History" table at the bottom of the page.
- Grouped rows: When ZAP and Nuclei run simultaneously in a single DAST trigger, both runs appear as one row grouped by group_id (commit a3be8037)
- Tool badges: Each row displays "ZAP", "Nuclei" badges to clearly identify which tools ran
- Unified results: ZAP and Nuclei results for the same domain are stored in the same dast_results row, so you can see both tools' counts at once
- Click to view: Click a history row to view results from that specific scan point (marked with "Viewing" label)
Key Detected Vulnerabilities
- Injection: SQL Injection, OS Command Injection, LDAP Injection
- XSS: Reflected XSS, Stored XSS, DOM-based XSS
- Misconfiguration: Missing Security Headers, unset Cookie Flags, CORS Misconfiguration, Directory Listing
- Authentication/Session: Broken Authentication, Session Fixation, CSRF
Troubleshooting
Scan Failure
-
Cannot access URL: This occurs when the domain is not connected to the external Nginx, or the KIOPS server cannot reach the URL. First confirm that the domain is properly registered on the external Nginx.
-
Timeout: Baseline/API scans time out after 450 seconds, Full scans after 900 seconds. If the target site is too large or slow, narrow the target domain scope.
-
SSL errors: If a self-signed certificate is used, check the certificate configuration of the target domain.
-
No domain registered: If no target domain exists, click the "Register domain here" button in the precondition panel on the Security Analysis page to add one inline. Supports various infrastructure types including external Nginx and Kubernetes Ingress.
Handling False Positives
DAST may also occasionally report something that is not actually vulnerable. Changing an alert to the false_positive or accepted_risk status auto-classifies identical items in future scans.
Related Guides
- SAST Scan - Source code analysis
- SCA Scan - Dependency analysis
- Security Gate - Combined deployment verdict across 6 areas