IaC Scan
How would you know if USER root is still left in a Dockerfile, or if a Kubernetes manifest is missing privilege restrictions? IaC (Infrastructure as Code) scanning inspects the code that defines your infrastructure and automatically finds security misconfigurations.
Infrastructure today is defined as code. Dockerfiles, Kubernetes manifests, and Terraform files are the blueprints of your infrastructure. If these blueprints contain incorrect settings, it can lead to security incidents such as containers running with excessive privileges or unnecessary ports being exposed externally. IaC scanning finds problems at the code level before infrastructure is deployed.
Overview
- Analysis target: Infrastructure definition code in a Git repository (Dockerfiles, Kubernetes manifests, Terraform, etc.)
- Analysis engine: Checkov
- Analysis basis: Checkov built-in policies (CIS Benchmark-based best practices)
- Result format: Pass/fail verdict per policy check item
SAST finds vulnerable logic in application source code, while IaC scanning finds incorrect configurations in infrastructure setting code. Both analyze code statically, but the inspection targets differ.
Step 1: Entering the IaC Scan
- Click the [Security Analysis] menu under the "Security" group in the sidebar.
- Select a service to analyze from the card carousel at the top of the page.
- Select the IaC tab.
Entering /security?id={serviceId}&area=iac opens the IaC tab for that service directly.
Step 2: Scan Input Items
The trigger bar at the top of the IaC tab uses the following items.
- Git repository URL (required): The repository URL where the infrastructure code is located
- Branch (optional, default
main): The branch name to analyze - Git token (optional, for private repos): A token with repository read permission
The Git URL, branch, and token can be registered in the Settings tab, shared across SAST/IaC/Secret. Once registered there, they are used automatically for IaC scans.
If you do not enter a Git token directly, the backend automatically uses the token stored in the Settings tab or in the organization settings.
Step 3: Running the Scan
When you click the Start Scan button, Checkov clones the repository and analyzes the infrastructure definition files. Progress is shown in real time via WebSocket.
Checkov automatically detects and inspects the following infrastructure definition files in the repository.
- Dockerfile: Base images, user privileges, exposed ports, etc.
- Kubernetes manifests (
*.yaml): Pod security contexts, resource limits, privilege settings, etc. - Terraform (
*.tf): Cloud resource settings, network rules, encryption settings, etc.
When the scan completes, the result screen updates automatically.
Step 4: Reviewing Results
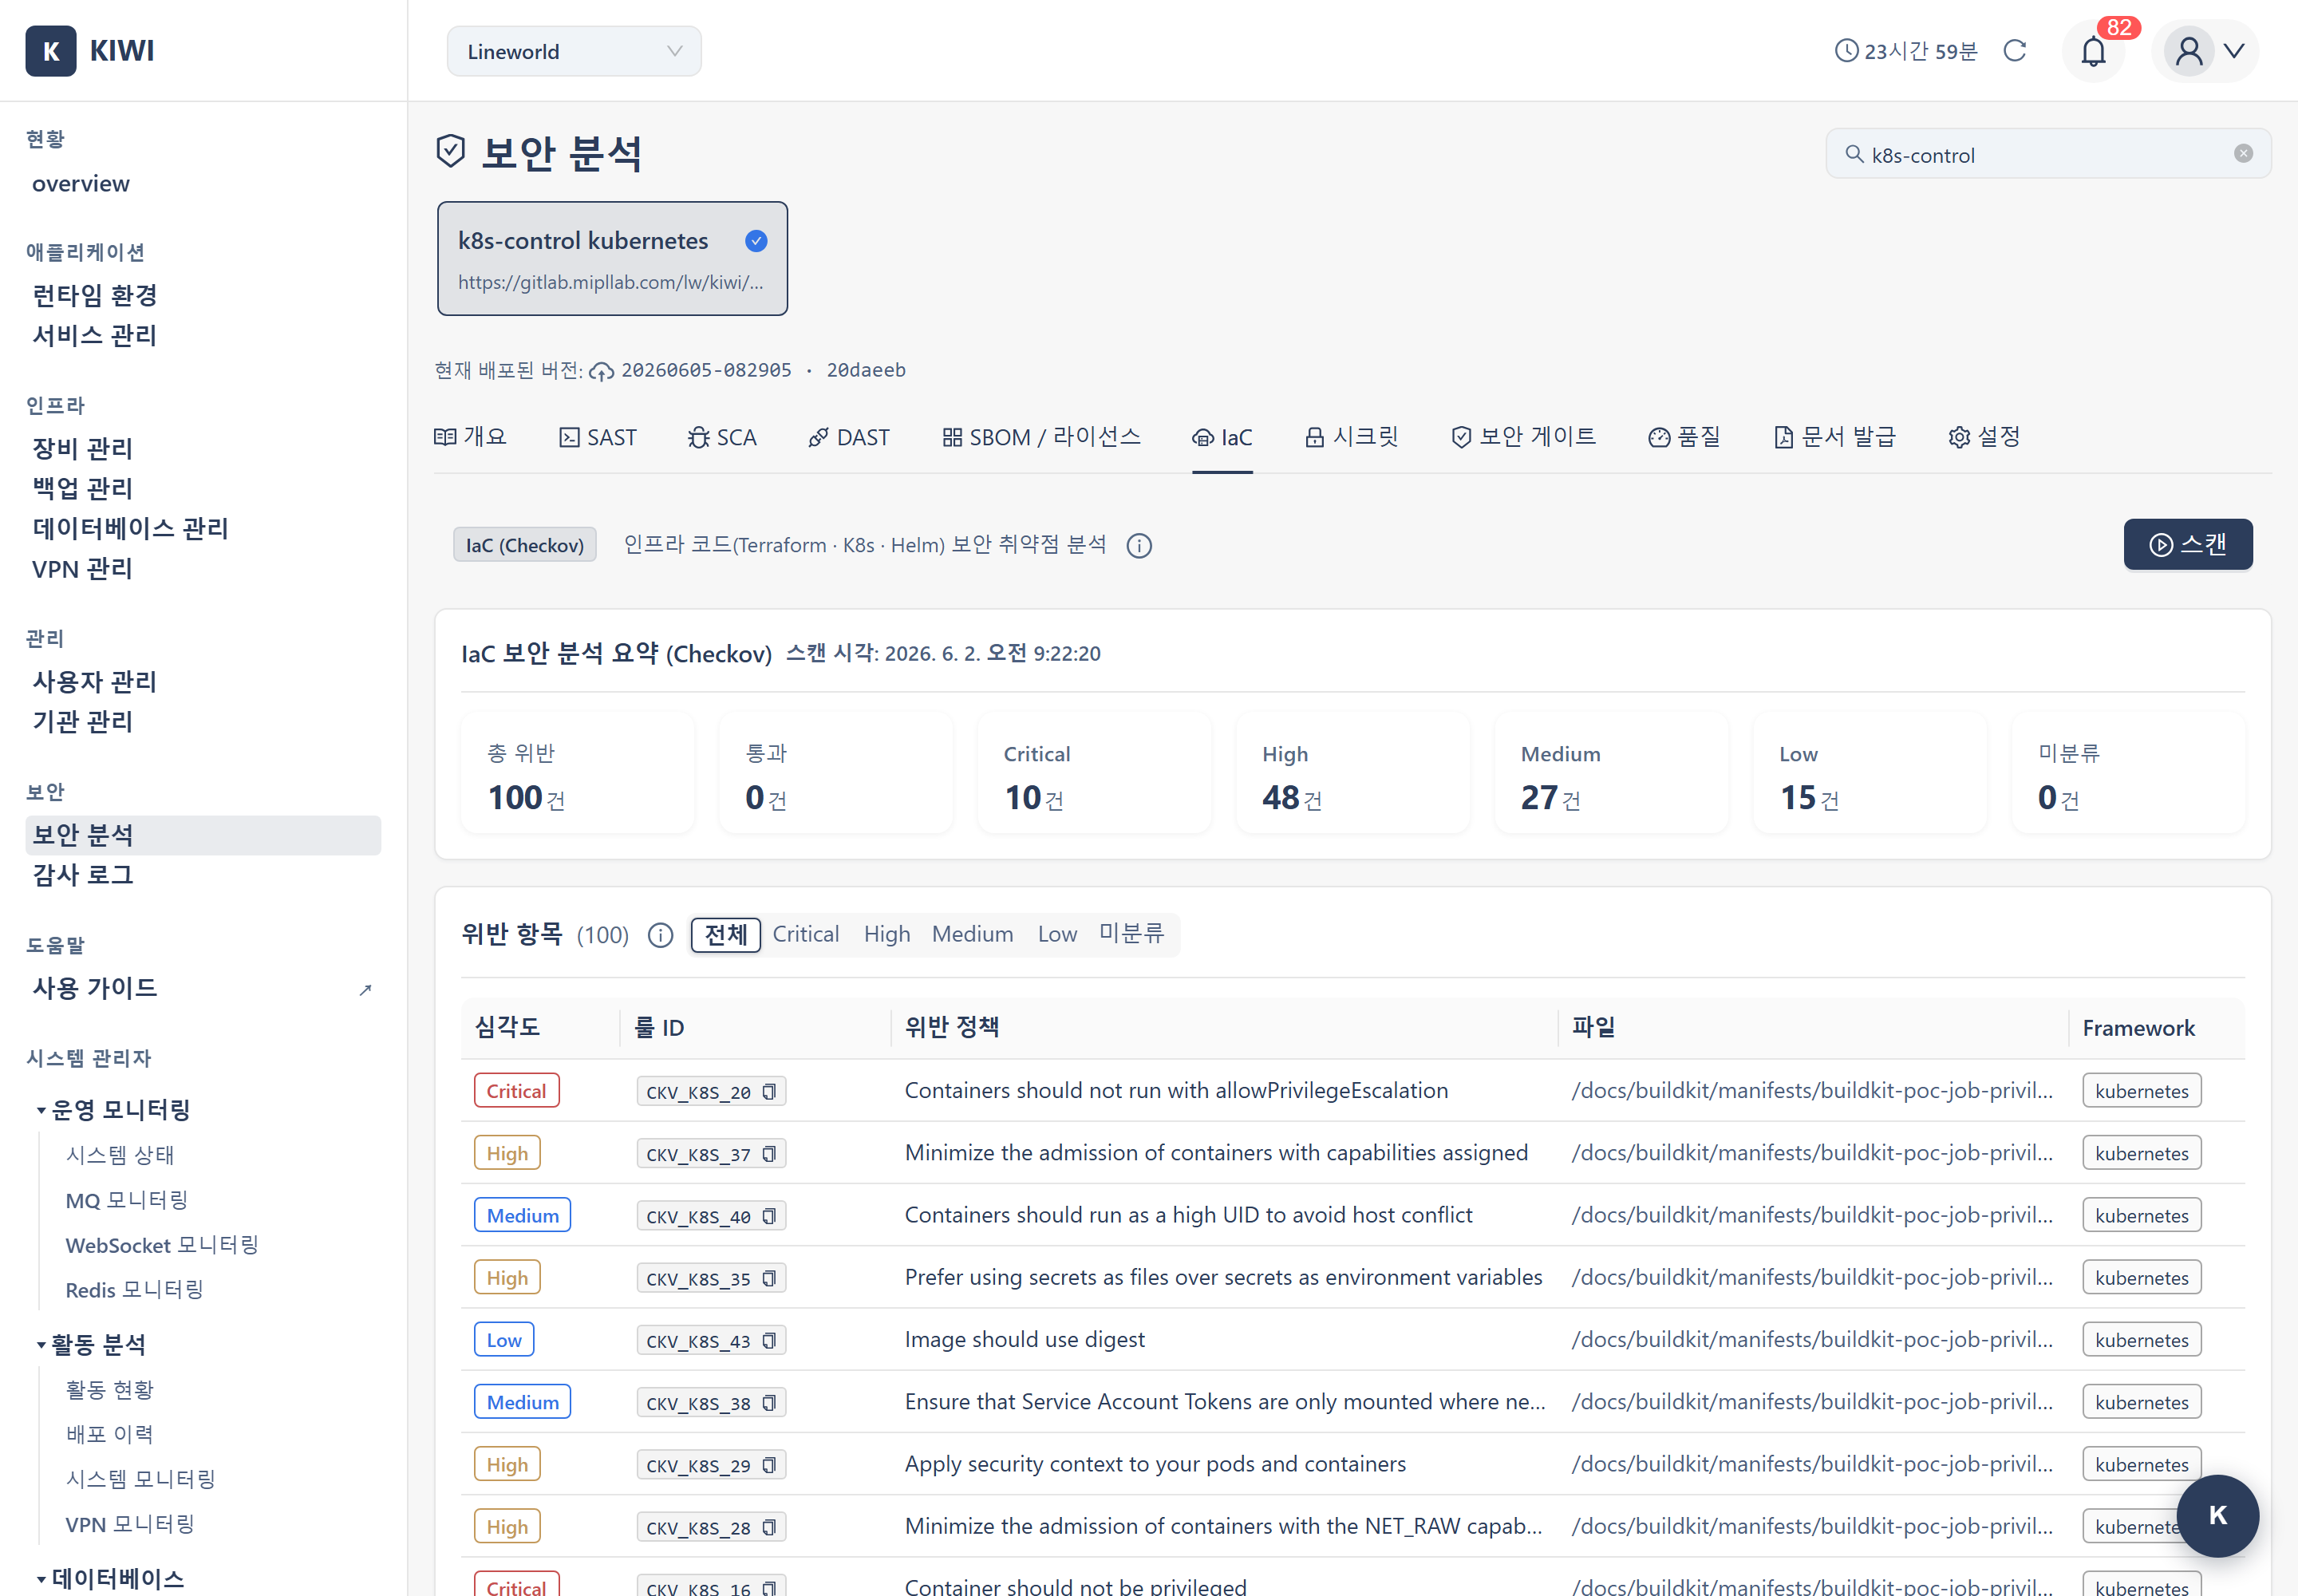
4.1 Result Summary
When the scan completes, you can review the following.
- Total checks: The total number of policy check items Checkov performed
- Pass / Fail: The number of passed and failed items
- By severity: The severity distribution of failed items (Critical/High/Medium/Low/Unknown) — items with unconfirmed severity are classified as Unknown.
4.2 Failed Item Details
Clicking a failed check item shows the following information.
- File location: The file path and line number where the problem was found
- Policy ID and description: Which Checkov policy was violated
- Severity: The severity of the problem
- Recommended action: Guidance on how to fix the configuration
4.3 Scan History
The Scan History table on the IaC tab lets you review policy violation trends over time. Since results accumulate with each scan, you can see your security improvement progress at a glance.
- Scan time: When each scan was executed
- Critical/High/Medium/Low: Number of violations per severity level
- Total violations: Cumulative violation count with change from previous scan (▲/▼)
- Viewing: Marks which point-in-time is currently displayed in the results area
Click a row in the history table to display that scan's detailed results (list of failed checks) in the results area. This is useful when comparing changes before and after a specific point in time.
Key Detected Items
Dockerfile
- Running as root user: When the container runs as root without a
USERdirective - Unpinned base image tag: When using the
latesttag breaks reproducibility - Unnecessary package installation: Including packages that widen the attack surface
Kubernetes Manifests
- Privilege escalation allowed: When
allowPrivilegeEscalationis not restricted - Missing resource limits: When CPU/memory limits are not set
- Read-only root filesystem not set: When
readOnlyRootFilesystemis not applied
Terraform
- Encryption not configured: When storage or database encryption is disabled
- Overly open network rules: When a security group exposes ports to
0.0.0.0/0
Running a container as root can endanger the host in the event of a container escape. Add a USER directive to the Dockerfile, and in Kubernetes restrict privileges with securityContext.
Troubleshooting
Scan Failure
-
Cannot access code: Check that the Git token has repository read permission. The token stored in the Settings tab or organization settings is used automatically.
-
No infrastructure files: If the repository has no Dockerfile, Kubernetes manifests, or Terraform files, there is nothing to inspect and results may be empty.
-
Timeout: Large repositories may take a long time to analyze. Limit the analysis scope to a specific branch.
Over-Detection
Checkov's built-in policies are based on strict best practices, so there may be many failed items. Address Critical/High severity items first.
Related Guides
- SAST Scan - Static source code analysis
- Secret Scan - Exposed credential detection
- Security Gate - Combined deployment verdict across 6 areas